Image Details
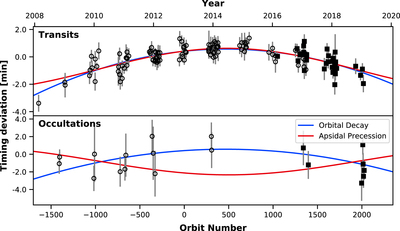
Caption: Figure 4.
Transit and occultation timing residuals, after subtracting the best-fitting constant-period model. Open circles denote those points previously compiled in Patra et al. (2017); solid squares are the new transit and occultation times compiled in this work. The blue line shows the expected residuals for the best-fitting orbital decay model, while the red line shows the best-fitting apsidal precession model.
Other Images in This Article

Copyright and Terms & Conditions
© 2019. The American Astronomical Society. All rights reserved.
Copyright ©
2026 Astronomy Image Explorer. All Rights Reserved.