Image Details
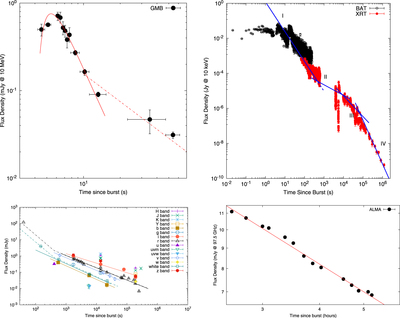
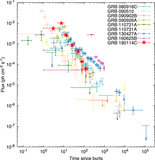
Caption: Figure 2.
The upper left-hand panel shows the GBM light curve at 10 MeV. The solid red line corresponds to the best-fit curve using Equation (1), and the dashed red line corresponds to an SPL. Data were taken from Ravasio et al. (2019). The upper right-hand panel shows the X-ray light curve obtained with Swift BAT (black) and XRT (red) instruments at 10 keV. Blue lines correspond to the best-fit curves using SPL functions. The Swift data were obtained using the publicly available database on the official Swift website. The lower left-hand panel shows the optical light curves of GRB 190114C in different filters with the best-fit functions. The continuous line corresponds to the best-fit curve using an SPL function, and the dotted–dashed line using a broken PL (BPL) function. Optical data were collected from Izzo et al. (2019), Mirzoyan et al. (2019), Bolmer & Shady (2019), Im et al. (2019a), Alexander et al. (2019), D’Avanzo et al. (2019), Kim & Im (2019a), Kumar et al. (2019), Kim & Im (2019b), Im et al. (2019b), and Mazaeva et al. (2019). The lower right-hand panel shows the radio light curve obtained with ALMA at 97.5 GHz. The red line corresponds to the best-fit curve using an SPL function. Radio data were taken from Laskar et al. (2019).
Other Images in This Article
Copyright and Terms & Conditions
© 2019. The American Astronomical Society. All rights reserved.