Image Details
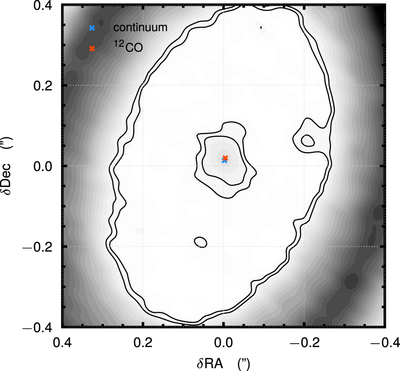
Caption: Figure 7.
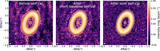
Position of the center of the continuum emission (blue cross) and of the disk rotation (red cross). The color scale indicates the continuum intensity. Solid contours are drown at 3 and 5 times the noise level as in the central panel of Figure 1.
Other Images in This Article
Copyright and Terms & Conditions
© 2019. The American Astronomical Society. All rights reserved.
Copyright ©
2026 Astronomy Image Explorer. All Rights Reserved.