Image Details
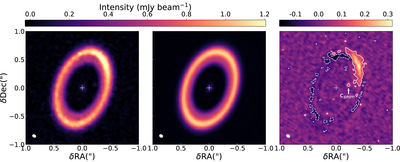
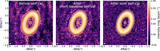
Caption: Figure 6.
Left panel: image of the 855 μm continuum emission recorded toward PDS 70 and imaged with a robust parameter equal to 0.3, as in the central panel of Figure 1. Middle panel: image of the symmetric component of the continuum emission calculated as discussed in Appendix B. Right panel: image of the residuals obtained by subtracting the symmetric component of the emission (middle panel) from the observations (left panel). Dashed and solid contours correspond to ±3× the rms noise level (rms = 19 μJy beam−1).
Other Images in This Article
Copyright and Terms & Conditions
© 2019. The American Astronomical Society. All rights reserved.
Copyright ©
2025 Astronomy Image Explorer. All Rights Reserved.