Image Details
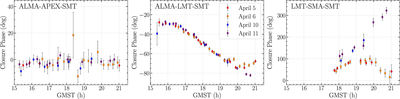
Caption: Figure 3.
Selected closure phases from coherently averaged visibilities on three triangles as a function of Greenwich Mean Sidereal Time (GMST) using data from all four days. Error bars denote ±1σ uncertainties from thermal noise. The trivial ALMA–APEX–SMT triangle (left panel) has closure phases near zero on all days, as expected because this triangle includes an intra-site baseline. Deviations from zero arise from a combination of thermal and systematic errors (Paper III). The ALMA–LMT–SMT triangle (middle panel) shows persistent structure across all days, while the large LMT–SMA–SMT triangle (right panel) shows source evolution between the first two days and last two days.
Other Images in This Article

Show More
Copyright and Terms & Conditions
© 2019. The American Astronomical Society.