Image Details
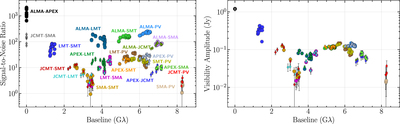
Caption: Figure 2.
Left panel: S/N as a function of projected baseline length for EHT observations of M87 on April 11. Each point denotes a visibility amplitude coherently averaged over a full scan (4–7 minutes). Points are colored by baseline. Right panel: visibility amplitudes (correlated flux density) as a function of projected baseline length after a priori and network calibration. The amplitudes are corrected for upward bias from thermal noise (Equation (6)). Error bars denote ±1σ uncertainty from thermal noise and do not include expected uncertainties in the a priori calibration (see Paper III and Section 4.1).
Other Images in This Article

Show More
Copyright and Terms & Conditions
© 2019. The American Astronomical Society.
Copyright ©
2026 Astronomy Image Explorer. All Rights Reserved.