Image Details
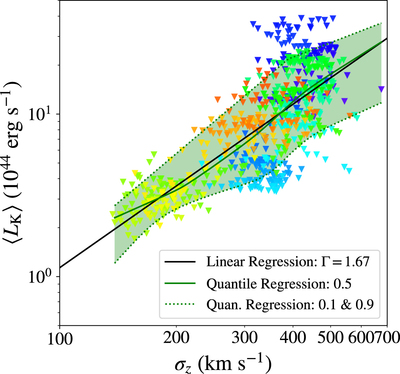
Caption: Figure 4.
﹩\langle {L}_{{\rm{K}}}\rangle ﹩ as a function of the velocity dispersion of the Hα filaments along the jet axis, σz. Data points correspond to 2 < t < 9 Gyr in simulation RT02, with the same color scheme as in Figure 1.
Other Images in This Article

Copyright and Terms & Conditions
© 2019. The American Astronomical Society. All rights reserved.
Copyright ©
2026 Astronomy Image Explorer. All Rights Reserved.