Image Details
Caption: Figure 1.
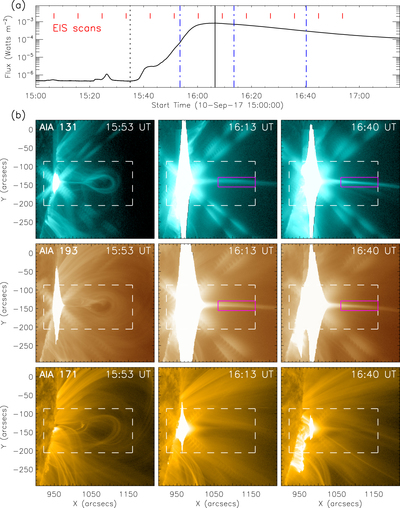
Overview of the flare observations. (a) GOES 1–8 Å soft X-ray flux. The short vertical red lines indicate the EIS scans. The vertical black dotted and solid lines denote the flare onset and peak times, respectively. The three blue dashed–dotted lines mark the times of AIA images in panel (b). (b) AIA 131, 193, and 171 Å images during the flare. The white box denotes the region as shown in Figures 2 and 3. The magenta box indicates the current sheet.
Other Images in This Article
Copyright and Terms & Conditions
© 2018. The American Astronomical Society. All rights reserved.
Copyright ©
2025 Astronomy Image Explorer. All Rights Reserved.