Image Details
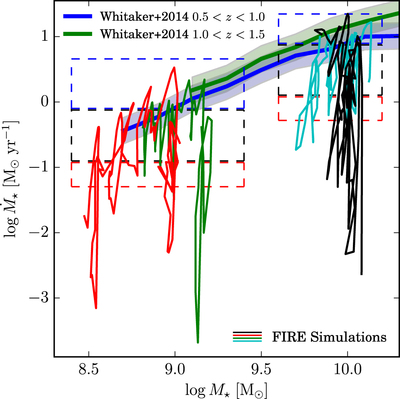
Caption: Figure 2.
Tracks of two individual galaxy runs from each M⋆ bin (individually colored) in the SFR–﹩{M}_{\star }﹩ plane for ﹩0.7\lt z\lt 1.5﹩. ﹩{\dot{M}}_{\star }﹩ is the 100 Myr averaged SFR within the central 20 kpc of each main halo; ﹩{M}_{\star }﹩ is calculated within the same aperture. Solid blue (green) lines indicate the “star formation main sequence” (MS) in the redshift interval ﹩0.5\lt z\lt 1.0﹩ (﹩1.0\lt z\lt 1.5﹩) found by Whitaker et al. (2014); the shaded regions represent the intrinsic scatter of 0.2 dex found by Speagle et al. (2014). The dashed colored boxes indicate the cuts used in this work to classify galaxies as above (blue), on (black), or below (red) the MS. At these redshifts, FIRE galaxies have rapidly changing SFRs and do not evolve parallel to the MS but rather cross it many times.
Other Images in This Article
Copyright and Terms & Conditions
© 2017. The American Astronomical Society. All rights reserved.