Image Details
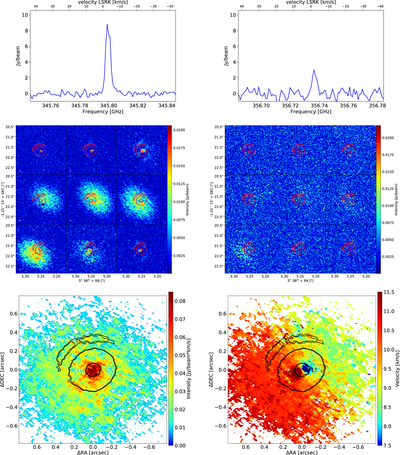
Caption: Figure 2.
Top: spectra extracted from the ALMA data for CO(3-2) (left) and HCO+ (4-3) (right). Middle: channel maps for the same lines. Bottom: CO moment 0 map (left) and moment 1 map (right). The contours indicate the continuum-emitting structure.
Other Images in This Article
Copyright and Terms & Conditions
© 2017. The American Astronomical Society. All rights reserved.
Copyright ©
2025 Astronomy Image Explorer. All Rights Reserved.