Image Details
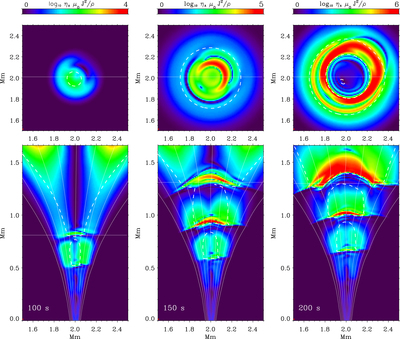
Caption: Figure 2.
Temporal evolution of the ambipolar heating term ﹩\mathrm{log}{\eta }_{A}{J}_{\perp }^{2}{\mu }_{0}/\rho ﹩. The horizontal and vertical cuts through the domain are shown in the top and bottom panels, respectively, for 100, 150 and 200 s of simulated physical time. The positions of the cuts are marked by thick white lines. The thin white lines are magnetic field lines. The dashed lines correspond to plasma ﹩\beta =1﹩ contours in the perturbed models.
Other Images in This Article


Copyright and Terms & Conditions
© 2016. The American Astronomical Society. All rights reserved.
Copyright ©
2026 Astronomy Image Explorer. All Rights Reserved.