Image Details
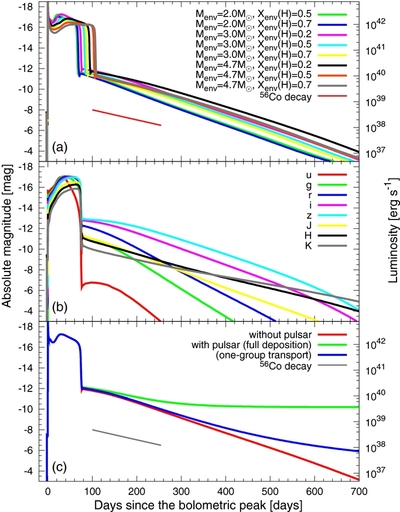
Caption: Figure 4.
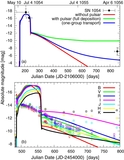
(a) Bolometric light curves of the ECSNe. The colors are the same as Figure 1, but the red line shows the energy release rate of the 56Co radioactive decay. (b) Multicolor light curves (red: u, green: g, blue: r, magenta: i, cyan: z, yellow: J, black: H, and gray: K) of the ECSN of the SAGB star with M env = 3.0 M ☉ and X env(H) = 0.2. (c) Bolometric light curves of the ECSNe without the pulsar contribution (red), with the full deposition (green), and with the one-group transport (blue). The energy release rate of the 56Co radioactive decay (gray) is also shown.
Other Images in This Article
Copyright and Terms & Conditions
© 2013. The American Astronomical Society. All rights reserved.