Image Details
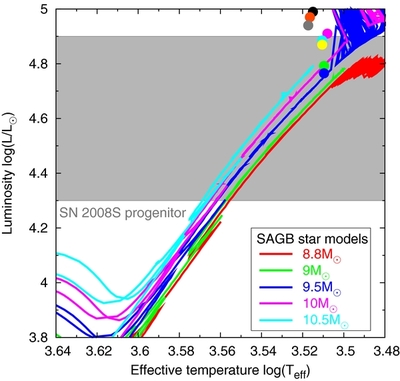
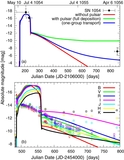
Caption: Figure 2.
Color–magnitude diagram of SAGB stars. The adopted progenitor models (filled circles; colors are the same as in Figure 1) are compared with evolutionary models of SAGB stars with various M MS (lines: M MS = 8.8 M ☉ (red), 9 M ☉ (green), 9.5 M ☉ (blue), 10 M ☉ (magenta), and 10.5 M ☉ (cyan), Siess 2007) and the luminosity range of the progenitor of SN 2008S (shaded gray region; Prieto et al. 2008; Botticella et al. 2009). L ☉ is the solar luminosity.
Other Images in This Article
Copyright and Terms & Conditions
© 2013. The American Astronomical Society. All rights reserved.
Copyright ©
2026 Astronomy Image Explorer. All Rights Reserved.