

Image Details
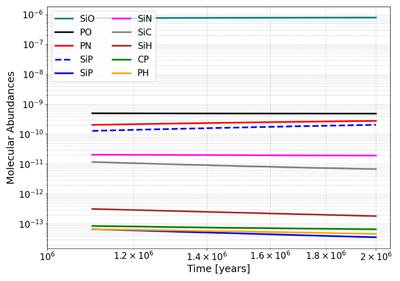
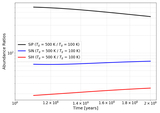
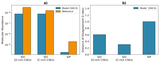
Caption: Figure 8.
Molecular abundances as a function of time in an evolved hot gas (T = 500 K, n(H2) = 2 × 105 cm−3). Solid lines show the evolution of species computed with the full reaction network (Model 1). The dashed blue line shows the SiP abundance when its destruction reactions are excluded (Model 2). This omission dramatically enhances SiP abundance, while the abundances of other species remain unaffected.
Other Images in This Article
Copyright and Terms & Conditions
© 2026. The Author(s). Published by the American Astronomical Society.

Copyright ©
2026 Astronomy Image Explorer. All Rights Reserved.
