

Image Details
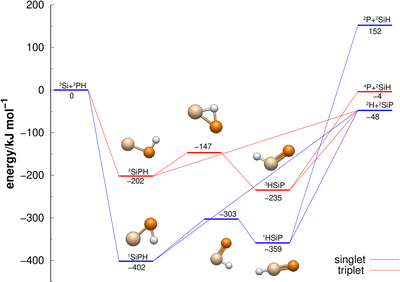
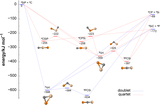
Caption: Figure 2.
Potential energy diagram for the [Si,P,H] system at the CCSD(T)-F12/cc-pVQZ-F12 level. Relative energies (kJ mol−1) include ZPE corrections; singlet and triplet surfaces are shown in blue and red, respectively.
Other Images in This Article
Copyright and Terms & Conditions
© 2026. The Author(s). Published by the American Astronomical Society.

Copyright ©
2026 Astronomy Image Explorer. All Rights Reserved.
