

Image Details
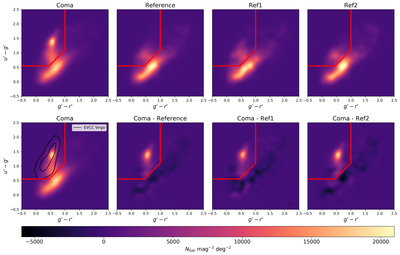
Caption: Figure 9.
﹩{u}^{{\prime} }-{g}^{{\prime} }﹩ vs. ﹩{g}^{{\prime} }-{r}^{{\prime} }﹩ number density color–color diagrams for the faint Coma cluster and comparison samples. The top row shows the density distributions for Coma, the combined reference fields, and the individual reference fields Ref1 and Ref2, all without completeness correction. The bottom row shows Coma with EVCC Virgo contours overlaid, followed by residual maps obtained by subtracting each reference sample from the Coma distribution. Galaxies in the top left of the red visualized selection cutoffs are considered to be quenched. The samples are limited to galaxies with ﹩m\lt 24\,{g}^{{\prime} }\,{\rm{mag}}﹩.
Other Images in This Article
Show More
Copyright and Terms & Conditions
© 2026. The Author(s). Published by the American Astronomical Society.

