

Image Details
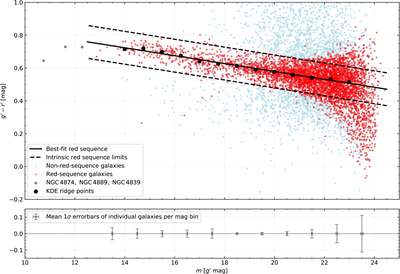
Caption: Figure 10.
﹩{g}^{{\prime} }-{r}^{{\prime} }﹩ color–magnitude diagram of the Coma cluster. The KDE ridge points are depicted as black dots, the best-fit red sequence as a solid black line, and the limits of the intrinsic red sequence as dashed black lines. Galaxies that deviate less than ﹩3\times {\rm{\Delta }}({g}^{{\prime} }-{r}^{{\prime} })﹩ from these limits are accounted as red-sequence members and are visualized in red, whereas nonred sequence members are depicted in blue. The three brightest galaxies, NGC 4874, NGC 4889, and NGC 4839, are shown separately as gray diamonds. In the bottom panel, we visualize the mean error bars of the individual galaxies within a magnitude bin. Note here that the colors of the faint galaxy sample were measured using aperture magnitudes and hence their uncertainties only include photon noise and the uncertainty of the background subtraction, whereas the colors of the bright sample (﹩m\lt 18\,{g}^{{\prime} }\,{\rm{mag}}﹩) are based on the SB profile modeling of the whole galaxy and hence also includes the modeling uncertainties causing larger error bars.
Other Images in This Article
Show More
Copyright and Terms & Conditions
© 2026. The Author(s). Published by the American Astronomical Society.

