

Image Details
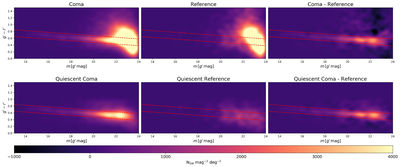
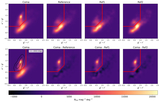
Caption: Figure 11.
﹩{g}^{{\prime} }-{r}^{{\prime} }﹩ vs. ﹩{m}_{{g}^{{\prime} }}﹩ number-density color–magnitude diagrams for the Coma cluster and reference fields. The top row shows the full galaxy samples for Coma, the combined reference fields, and the residual distribution obtained by subtracting the reference field distribution from the Coma distribution. The bottom row shows the corresponding distributions after applying the quiescent color–color preselection. The red dashed lines indicate the adopted 3σ intrinsic width around the fitted Coma red sequence.
Other Images in This Article
Show More
Copyright and Terms & Conditions
© 2026. The Author(s). Published by the American Astronomical Society.

Copyright ©
2026 Astronomy Image Explorer. All Rights Reserved.
