

Image Details
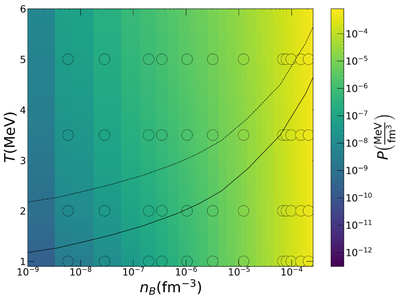
Caption: Figure 3.
Pressure (color axis) as a function of baryonic density and temperature from our calculations, including ionic pressure from MD from the neural network parameterization and electron pressure from the degenerate gas. Individual points are also depicted coming directly from MD particular runs. We show the region where the phase transition to uniform nuclear matter occurs between black dashed and solid lines, as taken from C. Ishizuka et al. (2003).
Other Images in This Article
Copyright and Terms & Conditions
© 2026. The Author(s). Published by the American Astronomical Society.

Copyright ©
2026 Astronomy Image Explorer. All Rights Reserved.
