

Image Details
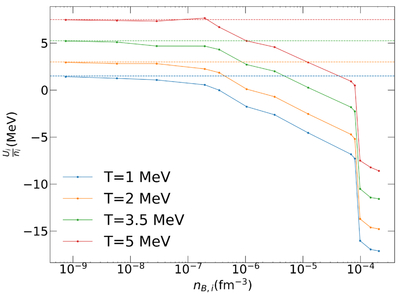
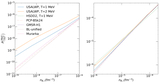
Caption: Figure 1.
Energy (from Equation (12)) as a function of baryonic density for ions. Solid lines correspond to the results of our microscopical simulations, while the ideal gas limit for each given temperature is shown as a dashed line, to showcase the system reaching it at sufficiently small densities.
Other Images in This Article
Copyright and Terms & Conditions
© 2026. The Author(s). Published by the American Astronomical Society.

Copyright ©
2026 Astronomy Image Explorer. All Rights Reserved.
