

Image Details
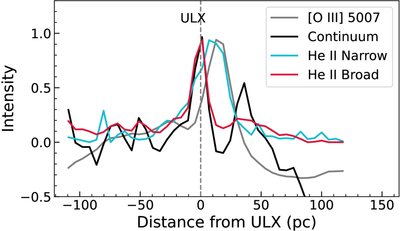
Caption: Figure 3.
Spatial profiles of emission lines and the continuum derived from the FORS2 data, with the peak normalized to unity. The continuum component in the emission lines has been subtracted. Note that the second peak in the continuum near 35 pc is due to a point-like star. The vertical dashed line marks the position of ULX.
Other Images in This Article
Copyright and Terms & Conditions
© 2026. The Author(s). Published by the American Astronomical Society.

Copyright ©
2026 Astronomy Image Explorer. All Rights Reserved.
