

Image Details
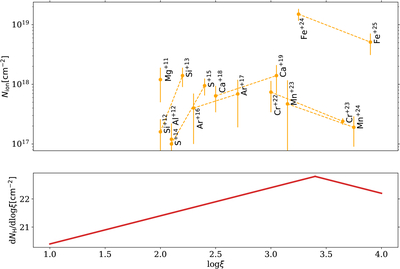
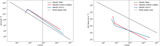
Caption: Figure 3.
(Top panel) Distribution of measured ionic column densities Nion in the GRS 1915+105 outflow of observations 23435+24663, each plotted at its ξ of maximal formation. This outlines the overall distribution of NH with ξ, showing a gradual increase, and then a turnover. The dashed lines represent the local slopes from H-like and He-like ion pairs, which are used to reconstruct the continuous AMD (see text), plotted in the bottom panel. Since there is no H in the spectrum, fion(ξ) and AZ of H-like Fe are used to scale the absolute AMD values in terms of NH (Equation (3)).
Other Images in This Article
Copyright and Terms & Conditions
© 2026. The Author(s). Published by the American Astronomical Society.

Copyright ©
2026 Astronomy Image Explorer. All Rights Reserved.
