

Image Details
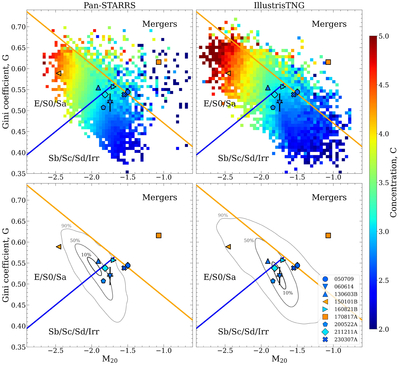
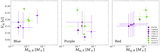
Caption: Figure 3.
A Gini-M20 comparison between our sample with the observed galaxies in Pan-STARRS (left panels) and the simulated galaxies from IllustrisTNG (right panels) from V. Rodriguez-Gomez et al. (2018). Each host in our sample has a unique marker. The color for our sample indicates the concentration value from MORFOMETRYKA while the color for the populations is the median concentration values for 2D bins calculated with statmorph. The bottom panels shows the density of the Pan-STARRS and IllustrisTNG populations with the contours depicting 10%/50%/90% of the galaxies.
Other Images in This Article
Copyright and Terms & Conditions
© 2026. The Author(s). Published by the American Astronomical Society.

Copyright ©
2026 Astronomy Image Explorer. All Rights Reserved.
