

Image Details
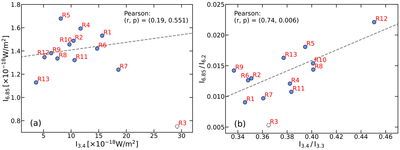
Caption: Figure 8.
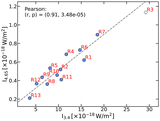
Left panel (a): relation between the 3.4 μm aliphatic C–H stretch and the 6.85 μm aliphatic C–H deformation. Right panel (b): I3.4/I3.3 versus I6.85/I6.2. The results for R3 are indicated by the dashed open circle due to its low-quality spectrum, and this region has been excluded from the correlation analysis. While I3.4 is not correlated with I6.85, I3.4/I3.3 is positively correlated with I6.85/I6.2, confirming the aliphatic nature of the 6.85 μm band. That the 3.4 μm emitter and the 6.85 μm emitter are different in size explains why I3.4 is not correlated with I6.85.
Other Images in This Article
Copyright and Terms & Conditions
© 2026. The Author(s). Published by the American Astronomical Society.

Copyright ©
2026 Astronomy Image Explorer. All Rights Reserved.
