

Image Details
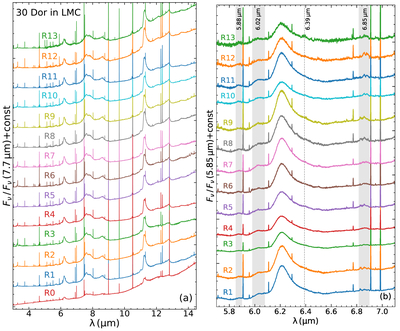
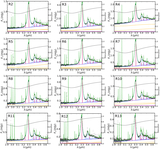
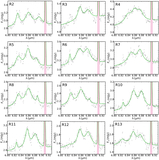
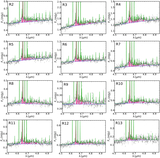
Caption: Figure 2.
Left panel (a): The 3.0–14.5 μm spectra of regions 0–13 (from bottom to top), normalized at 7.7 μm. The spectra are shifted vertically for clarity. Right panel (b): zoomed-in view in the 5.7–7.1 μm wavelength range for regions 1–13 (from bottom to top), normalized at 5.85 μm. The spectra have been vertically shifted for clarity. Shaded belts highlight the weak 5.88 and 6.02 μm features, as well as the 6.85 μm complex. The vertical dashed line indicates the tentative, weak subfeature at 6.39 μm.
Other Images in This Article
Copyright and Terms & Conditions
© 2026. The Author(s). Published by the American Astronomical Society.

Copyright ©
2026 Astronomy Image Explorer. All Rights Reserved.
