

Image Details
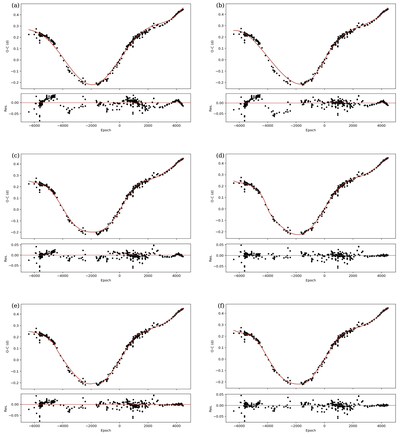
Caption: Figure 3.
(a)–(f): Models (a)–(f). Upper panels: the black dots are O − C values, while the red lines are best-fitting curves to the O − C diagram of SW Cyg for cases of different models. Lower panels: the residuals from the model fit.
Other Images in This Article
Copyright and Terms & Conditions
© 2026. The Author(s). Published by the American Astronomical Society.

Copyright ©
2026 Astronomy Image Explorer. All Rights Reserved.
