

Image Details
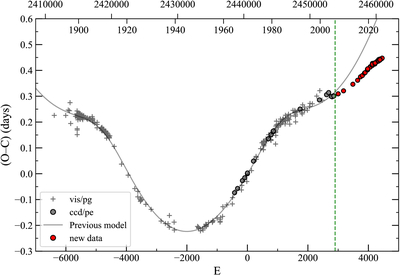
Caption: Figure 2.
O − C diagram. The gray crosses represent vis/pg data, and the gray circles represent ccd/pe data. The filled red dots indicate new data after 2007. The gray line is the fitting model proposed by A. Erdem et al. (2007).
Other Images in This Article
Copyright and Terms & Conditions
© 2026. The Author(s). Published by the American Astronomical Society.

Copyright ©
2026 Astronomy Image Explorer. All Rights Reserved.
