

Image Details
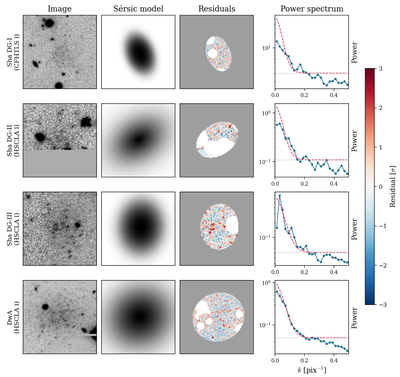
Caption: Figure 3.
Surface-brightness fluctuation models of the three dwarf candidates and DwA (used as a consistency check). The first column displays the CFHTLS or HSCLA i-band cutouts of the galaxies. The second column shows the best-fit Sérsic models. The model-subtracted residuals used for SBF are shown in the third column, with a color bar in units σ. The last column displays the power spectra with the model P(k) as a dotted red line. The observed spectrum is the dotted blue line, and the noise level is shown in gray. The HSCLA Sérsic model of Sha DG-II is elongated as it overlaps with the coverage edge; this does not affect its SBF distance, which is in agreement with CFHTLS coverage. The CFHTLS model is used instead for nSérsic and ϵ.
Other Images in This Article
Copyright and Terms & Conditions
© 2026. The Author(s). Published by the American Astronomical Society.

