

Image Details
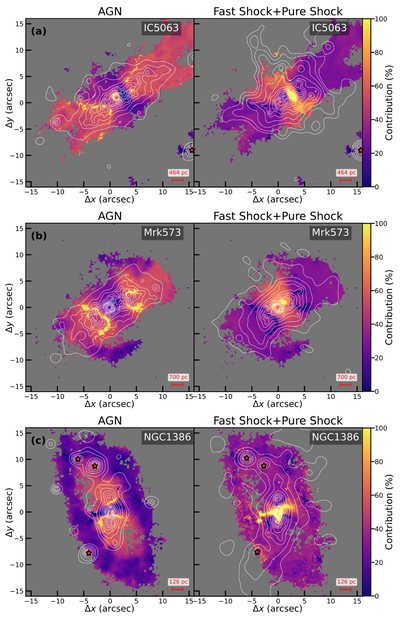
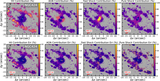
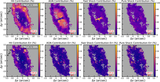
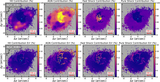
Caption: Figure 10.
Comparisons between Chandra X-ray contours and optically decomposed 2D fractional contribution maps for IC 5063, Mrk 573, and NGC 1386. Left panels: X-ray contours in the photoionization-dominated energy band (white) overlaid on the optical AGN fractional contribution maps. Right panels: X-ray contours in the thermal-dominated energy band (white) overlaid on the optical shock (fast+pure shock) fractional contribution maps. Red stars outlined in black mark X-ray point sources identified by RM26 as likely contaminants, such as X-ray binaries.
Other Images in This Article
Show More
Copyright and Terms & Conditions
© 2026. The Author(s). Published by the American Astronomical Society.

Copyright ©
2026 Astronomy Image Explorer. All Rights Reserved.
