

Image Details
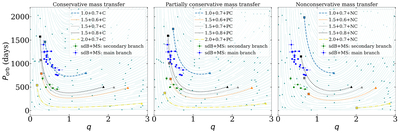
Caption: Figure 1.
Evolution of the orbital period, Porb, as a function of mass ratio, q = Mdon/Macc. Dashed, dotted, and dashed–dotted lines illustrate the evolution for 1, 1.5, and 2 M⊙ donors, respectively. Triangles and squares indicate the initial (i.e., at the RLOF onset) and final (i.e., post-mass-transfer) positions of the models, respectively. Teal arrows correspond to Equation (6) and indicate the evolution of Porb as mass transfer proceeds (i.e., as q decreases) for e = 0.001 and x = 0.99. From left to right: conservative mass transfer (β = 1), partially conservative mass transfer (β = 0.5) under isotropic reemission (γ = q), and nonconservative mass transfer (β = 0) under isotropic reemission (γ = q). Blue and green circles represent observed post-mass-transfer sdB+MS systems (Table B1). Blue circles correspond to the main branch (Porb ≳ 750 days) and green circles to the secondary branch (Porb ≲ 750 days). The parameters of the models at the onset of mass transfer (triangles) are listed in Table B2. The post-mass-transfer parameters of the models (squares) are listed in Table 1.
Other Images in This Article
Copyright and Terms & Conditions
© 2026. The Author(s). Published by the American Astronomical Society.

