

Image Details
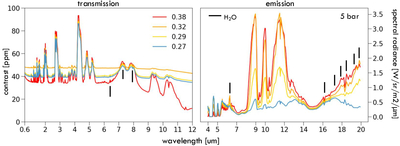
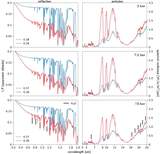
Caption: Figure 7.
Modeled transmission (left column) and emission (right column) spectra for planetary “edge cases” around TRAPPIST-1 at pCO2 = 5 bar. Blue spectral lines indicate the highest insolation considered that does not reach equilibrium. Red, orange, and yellow spectral lines denote insolation values that reach equilibrium and are considered to be habitable planets. Temperature values that correspond to these insolation values can be found in Table 3.
Other Images in This Article
Copyright and Terms & Conditions
© 2026. The Author(s). Published by the American Astronomical Society.

Copyright ©
2026 Astronomy Image Explorer. All Rights Reserved.
