

Image Details
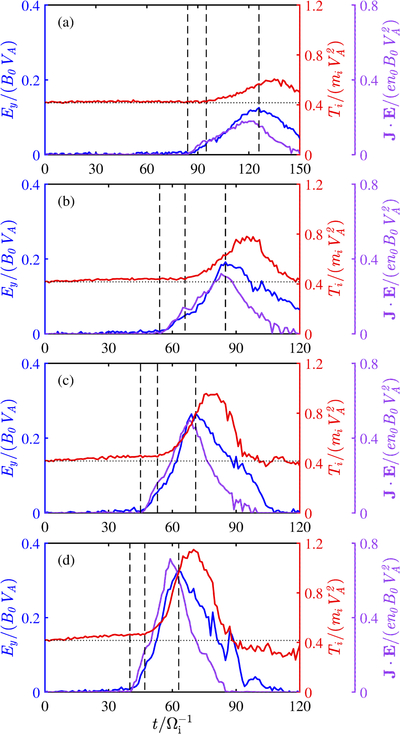
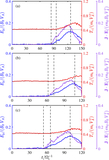
Caption: Figure 5.
Time history of the reconnection electric field ﹩{E}_{y}﹩ (blue line), ﹩{\boldsymbol{J}}{\boldsymbol{\cdot }}{\boldsymbol{E}}﹩ (purple line), and the ion temperature ﹩{T}_{i}﹩ (red line) for the runs in Group B. The initial ion temperature ﹩{T}_{i}=0.4167{m}_{i}{V}_{{\rm{A}}}^{2}﹩ is presented by the black dotted lines. Three key time points are indicated by black dashed lines: the reconnection onset, the end of the electron-only stage, and the peak of the reconnection electric field, occurring at (a) ﹩t=84{{\rm{\Omega }}}_{i}^{-1},95{{\rm{\Omega }}}_{i}^{-1},126{{\rm{\Omega }}}_{i}^{-1}﹩ in Run B1, (b) ﹩{t}=54{{\rm{\Omega }}}_{i}^{-1},66{{\rm{\Omega }}}_{i}^{-1},85{{\rm{\Omega }}}_{i}^{-1}﹩ in Run B2, (c) ﹩{t}=45{{\rm{\Omega }}}_{i}^{-1},53{{\rm{\Omega }}}_{i}^{-1},71{{\rm{\Omega }}}_{i}^{-1}﹩ in Run B3, and (d) ﹩t=40{{\rm{\Omega }}}_{i}^{-1},47{{\rm{\Omega }}}_{i}^{-1},63{{\rm{\Omega }}}_{i}^{-1}﹩ in Run B4.
Other Images in This Article
Copyright and Terms & Conditions
© 2026. The Author(s). Published by the American Astronomical Society.

