

Image Details
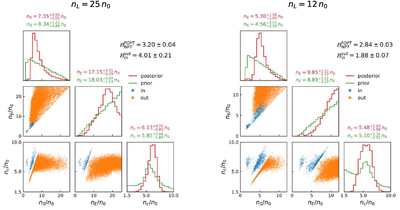
Caption: Figure 1.
Corner plots of the posterior distributions of the FOPT onset density nS, end density nE, and central density nc of the most massive neutron star for the two choices of the termination density nL: nL = 25 n0 (left panel) and nL = 12 n0 (right panel). In each panel, the diagonal subpanels show the priors and one-dimensional marginalized posteriors, with the median and 68% credible interval reported in each panel title; the Bayes factors ﹩{{ \mathcal B }}_{{\rm{NPT}}}^{{\rm{FOPT}}}﹩ and ﹩{{ \mathcal B }}_{{\rm{in}}}^{{\rm{out}}}﹩ are also annotated. The off-diagonal panels display equally weighted posterior samples, with blue (nS < nc) and orange (nS ≥ nc) marking FOPT onsets below and above nc, respectively.
Other Images in This Article
Copyright and Terms & Conditions
© 2026. The Author(s). Published by the American Astronomical Society.

