

Image Details
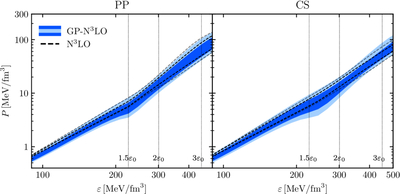
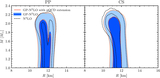
Caption: Figure 6.
Pressure-energy density posterior distributions for the PP (left panel) and CS (right panel) extensions with Bayesian χEFT uncertainties up to 1.5n0 with pQCD extensions (GP-N3LO, blue regions) and uniformly sampled in the previous N3LO range (N3LO, black dashed lines). The dark (light) blue regions and the inner (outer) black dashed lines encompass the 68% (95%) credible intervals. The vertical thin lines mark the points of 1.5, 2, and 3ε0 for easier reference.
Other Images in This Article
Show More
Copyright and Terms & Conditions
© 2026. The Author(s). Published by the American Astronomical Society.

Copyright ©
2026 Astronomy Image Explorer. All Rights Reserved.
