

Image Details
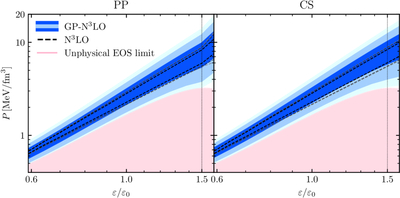
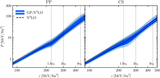
Caption: Figure 1.
Pressure-energy density prior distributions for the PP (left panel) and CS (right panel) extensions with Bayesian χEFT uncertainties up to 1.5 n0 (GP-N3LO, blue regions) and uniformly sampled in the previous N3LO range (N3LO, black dashed lines). The dark (light, lighter) blue regions and dashed black (gray, lighter gray) lines encompass the 68% (95% and 99.7%) credible intervals for the GP-N3LO and N3LO cases, respectively. The pink region shows all EOSs excluded from the prior for their unphysical behavior above 1.5ε0, indicated by the vertical thin dotted line.
Other Images in This Article
Show More
Copyright and Terms & Conditions
© 2026. The Author(s). Published by the American Astronomical Society.

Copyright ©
2026 Astronomy Image Explorer. All Rights Reserved.
