

Image Details
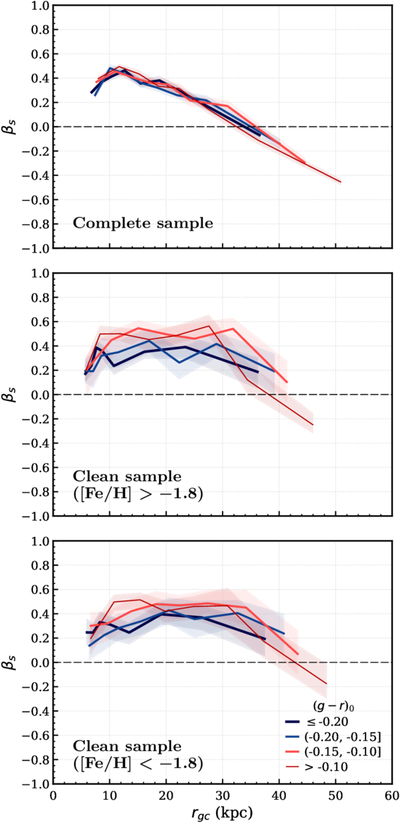
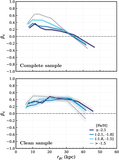
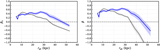
Caption: Figure 7.
Anisotropy profiles for color bins dividing the complete (top panel) and clean sample ([Fe/H] > −1.8, middle panel; and [Fe/H] < −1.8, bottom panel). Color bins are indicated by color and thickness. The lines correspond to the median values and the respective bands indicate the limits using 16th and 84th percentiles obtained with MC simulation.
Other Images in This Article
Copyright and Terms & Conditions
© 2026. The Author(s). Published by the American Astronomical Society.

Copyright ©
2026 Astronomy Image Explorer. All Rights Reserved.
