

Image Details
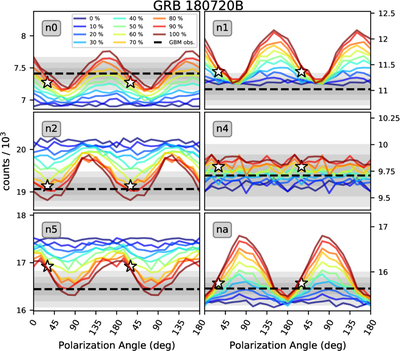
Caption: Figure 4.
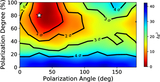
Modulation of the simulated photons in GBM. The colors indicate different polarization degrees. The dashed line shows the detected counts with the shaded region indicating the 1σ, 2σ, and 3σ uncertainties (statistical only). Stars indicate the best χ2 value computed for all detectors by scanning the PA–PD grid (Figure 5), which is (PA, PD) = (30°, 80%). We extended the x-axis to show two periods for clarity.
Other Images in This Article
Copyright and Terms & Conditions
© 2026. The Author(s). Published by the American Astronomical Society.

Copyright ©
2026 Astronomy Image Explorer. All Rights Reserved.
