

Image Details
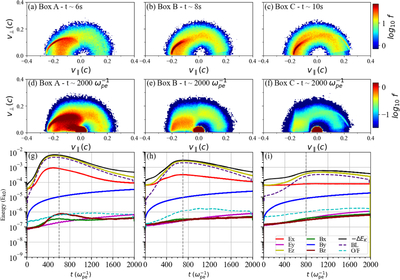
Caption: Figure 3.
Macroscopic guiding-center results show the evolution of beam-driven structures as electrons move from Box A (t ∼ 6 s) to Box B (t ∼ 8 s) and Box C (t ∼ 10 s), representing the evolution of energetic electrons from the looptop to a footpoint (a)–(c). The interaction of the energetic electron VDFs with the background plasma after around ﹩\sim 2000\,{\omega }_{pe}^{-1}﹩ (d)–(f). Temporal evolution of electromagnetic and particle energy variation for the six field components and the negative change in total electron kinetic energy (−ΔEk(t)), which shows the energy mostly transferred to the parallel electric fields (g)–(i). The vertical lines in different cases indicate the time at which the parallel electric field reached its maximum energy. The animation shows the evolution of the EVDFs in different boxes, starting at injection time and continuing for approximately 12 s. The real-time duration of the video is 24 s.
(An animation of this figure is available in the online article.)
(An animation of this figure is available.)
The video/animation of this figure is available in the online journal.
Other Images in This Article
Copyright and Terms & Conditions
© 2026. The Author(s). Published by the American Astronomical Society.

