

Image Details
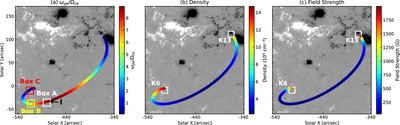
Caption: Figure 2.
(a) Reconstructed magnetic field line from the NLFFF extrapolation, used for deriving the frequency ratio profile along the selected loop. (b) Hydrostatic density model along the magnetic field line consistent with the observed radio-emission frequency range and SPDB dynamic spectrum. (c) The extrapolated field line of the coronal loop indicates the probable emission region, with color representing magnetic field strength in Gauss. The letter “I” marks the injection site. The approximate locations of K13 and K6 flare kernels are shown on the background HMI image (b) and (c). The magnetogram data was observed at 07:00 UT.
Other Images in This Article
Copyright and Terms & Conditions
© 2026. The Author(s). Published by the American Astronomical Society.

