

Image Details
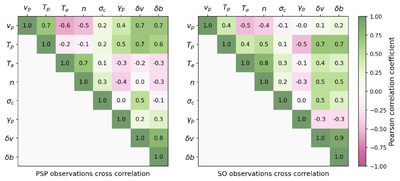
Caption: Figure 5.
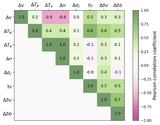
Correlation matrices of plasma parameters observed at PSP and SO within source alignments. Left panel: cross-correlation matrix for PSP alignment observations. Right panel: cross-correlation matrix for SO alignment observations. All quantities are averaged over τinj. Because the quantities span different orders of magnitude and are typically related by power laws, logarithmic values are used when computing correlations. As the diagonal elements represent autocorrelations, their coefficients are equal to unity by definition. Owing to the symmetry of the matrices, only the upper-right portions are displayed.
Other Images in This Article
Copyright and Terms & Conditions
© 2026. The Author(s). Published by the American Astronomical Society.

