

Image Details
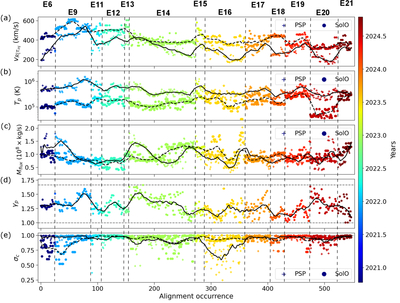
Caption: Figure 4.
Same format as Figure 2, but for additional plasma parameters. Panel (a): bulk solar wind speed; panel (b): proton temperature; panel (c): mass flux defined by ﹩{M}_{\mathrm{flux}}=({m}_{{\rm{p}}}+{m}_{{\rm{e}}})\,{v}_{R| {\tau }_{\mathrm{inj}}}\,n\,{R}^{2}﹩; panel (d): proton polytropic index, derived from the logarithmic slope of the polytropic relation between Tp and n between PSP and SO for each alignment. All quantities are averaged or computed over the injection time τinj (see Appendix A.1 for the details). PSP and SO observations are shown as crosses and dots, respectively, in panels (a)–(d). Mean trends are indicated by running averages over 10 occurrences, with solid and dashed lines for PSP and SO, respectively, and a solid line in panel (d). The corresponding PSP encounters are indicated at the top of the figure and separated by vertical dashed lines.
Other Images in This Article
Copyright and Terms & Conditions
© 2026. The Author(s). Published by the American Astronomical Society.

