Image Details
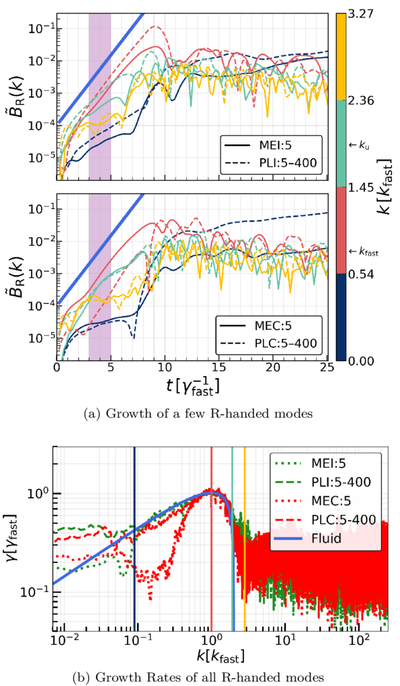
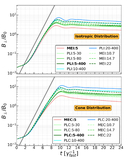
Caption: Figure 11.
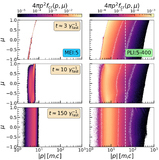
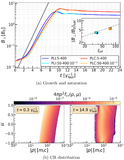
Top panel: Evolution of a few R-handed (﹩{\tilde{B}}_{\,\rm{R}\,}=| {\tilde{B}}_{y}(k)+j{\tilde{B}}_{z}(k)| ﹩) components of transverse magnetic fields in the benchmark isotropic (upper panel) and cone (lower panel) runs. The color palette in the color bar represents different modes. The growth of the modes k ∼ kfast matches the analytical expectation (blue solid lines). We calculate their growth rates numerically within ﹩t\in [3,5]{\gamma }_{{\rm{fast}}}^{-1}﹩ shaded in purple. Bottom panel: Growth rates of all the R-handed modes in the benchmark runs. The dominant modes match the analytical dispersion in Equation (3) (blue solid line). The vertical lines mark the modes plotted in the top panel.
Other Images in This Article
Show More
Copyright and Terms & Conditions
© 2026. The Author(s). Published by the American Astronomical Society.