Image Details
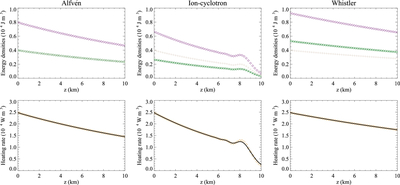
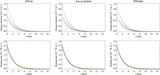
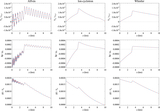
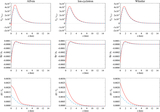
Caption: Figure 4.
Time-averaged energy densities (top panels) and heating rates (bottom panels) computed from simulations of Alfvén waves (left column), ion-cyclotron waves (center column), and whistler waves (right column) with a period of τ = 0.02 s and amplitude of the driver given by Ac = 0.01cA,T. Case of a plasma with np = 1.4 × 10¹⁵ m−3, χ = 100, B0 = 10 G, and νnc = 100ω. Diamonds, asterisks, and crosses in the top panels represent the total energy density ﹩\langle { \mathcal U }\rangle ﹩, the magnetic energy density ﹩\langle { \mathcal M }\rangle ﹩, and the total kinetic energy density ﹩\langle { \mathcal K }\rangle ﹩. The solid lines in the bottom panels represent the heating rates computed using Equation (39).
Other Images in This Article
Copyright and Terms & Conditions
© 2026. The Author(s). Published by the American Astronomical Society.