

Image Details
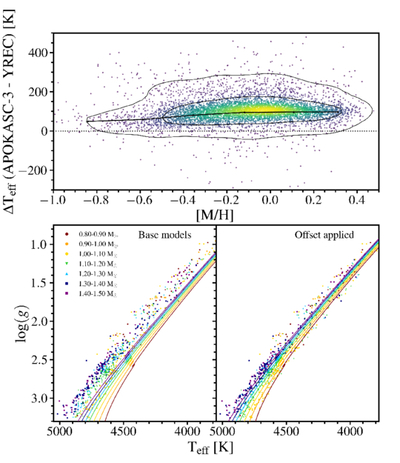
Caption: Figure 8.
Top: difference between APOKASC-3 and YREC effective temperatures for the RGB sample in the APOKASC-3 catalog. The contours represent 68% and 95% of the stars in the sample. Bottom: Kiel diagrams of APOKASC-3 RGB stars with metallicities in the range −0.05 < [M/H] < +0.05. The right panel shows the sample overlaid with the base-grid solar metallicity tracks. The track colors correspond to the lower boundary of the mass bins. The left panel shows the same tracks after applying the temperature offset shown in the top panel.
Other Images in This Article
Show More
Copyright and Terms & Conditions
© 2026. The Author(s). Published by the American Astronomical Society.

Copyright ©
2026 Astronomy Image Explorer. All Rights Reserved.
