

Image Details
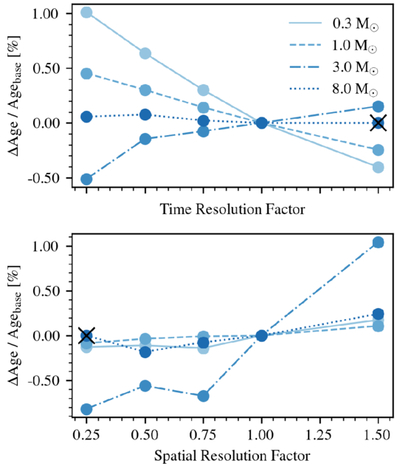
Caption: Figure 22.
Spatial and temporal resolution tests for solar metallicity models at 0.3, 1.0, 3.0, and 8.0 M⊙. The tolerances from the grid namelists were multiplied by the indicated factors, and the resulting percent change in the TAMS age is shown relative to the base-resolution model. The crosses denote failures to converge.
Other Images in This Article
Show More
Copyright and Terms & Conditions
© 2026. The Author(s). Published by the American Astronomical Society.

Copyright ©
2026 Astronomy Image Explorer. All Rights Reserved.
