

Image Details
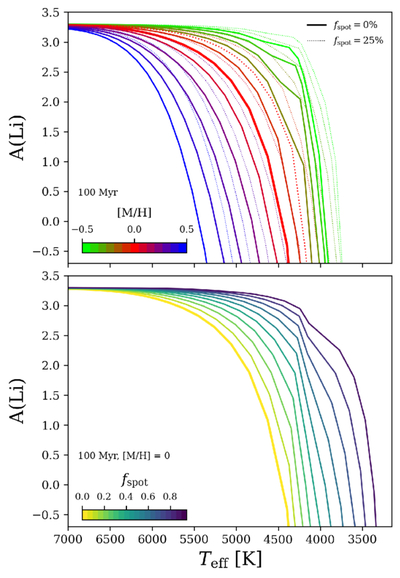
Caption: Figure 17.
Starspot lithium isochrones evaluated at 100 Myr for various metallicities and starspot filling factors. The top plot shows the variation of the lithium abundance pattern with metallicity (between −0.5 and +0.5, stepping by 0.1 dex), for unspotted (solid) and 25% spotted (dotted) cases. The bottom plot shows the variation of a 100 Myr solar metallicity lithium abundance pattern with starspot filling factor from fspot = 0.0 to 0.9, stepping by 0.1.
Other Images in This Article
Show More
Copyright and Terms & Conditions
© 2026. The Author(s). Published by the American Astronomical Society.

Copyright ©
2026 Astronomy Image Explorer. All Rights Reserved.
