Image Details
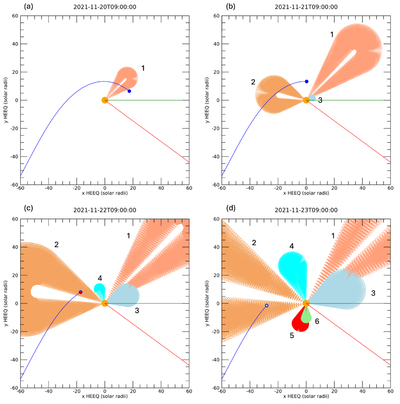
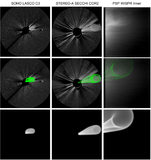
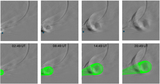
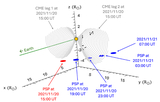
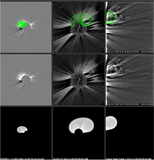
Caption: Figure 4.
Polar view indicating the CME location at four particular times (indicated by the label above each panel), and its comparison with PSP’s position (blue circle). Each CME is represented by a GCS model with a different color and a label indicating its number. The Sun location is represented by the orange circle (not to scale). The Sun–Earth line is represented in green, and the red line is the direction of STEREO-A. An animation is available, covering the period from 2021 November 20 to 2021 November 24. The real-time duration of the movie is 20 s.
(An animation of this figure is available in the online article.)
(An animation of this figure is available.)
The video/animation of this figure is available in the online journal.
Other Images in This Article
Show More
Copyright and Terms & Conditions
© 2026. The Author(s). Published by the American Astronomical Society.