Image Details
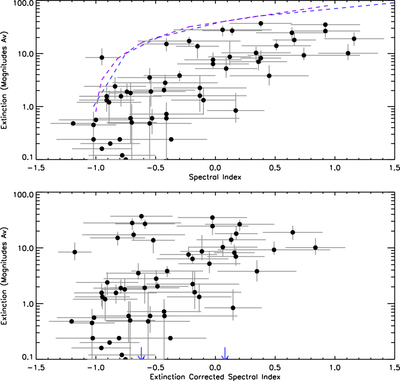
Caption: Figure 8.
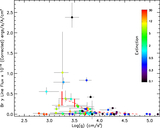
Top: the close correlation between magnitudes of visual extinction and spectral index, shown here for Class I and II YSOs, is in part due to extinction itself. The blue curve illustrates the path of a CTTS on this diagram as extinction is added, using the extinction law in A. N. Cox (2000), while the purple curve uses the extinction law from R. Indebetouw et al. (2005). Most objects have a higher spectral index than explained by extinction alone, showing that they have a true IR excess. We note that there are no objects with a high spectral index and low extinction, exactly what one would expect from a recently ejected YSO. This suggests that once ejected, the IR excess quickly decreases to Class II levels. More importantly, high extinction is necessary to maintain a high spectral index, i.e., an object needs to be embedded in a cloud to have a high IR excess. Bottom: after correcting the spectral indices for extinction, six deeply embedded Class I YSOs have corrected spectral indexes that are more consistent with a CTTS, suggesting that these may be good candidates for far-side T Tauri stars, or have edge-on disks.
Other Images in This Article
Copyright and Terms & Conditions
© 2026. The Author(s). Published by the American Astronomical Society.