Image Details
Caption: Figure 1.
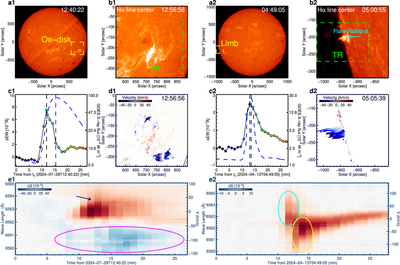
CHASE imaging and spectral observations of the events that occurred on 2024 July 29 (event 1, on-disk active region eruption) and 2024 April 13 (event 2, front-side limb active region eruption). (a1) The full-disk solar imaging of event 1 at the Hα line center. The yellow dashed region is the cropped source region (b1). (b1) The source region of event 1. The green dashed region is the TR. (c1) Light curves of HαΔEW (colored circles) and GOES-SXR 1–8 Å flux (blue dashed curve) of event 1. The black and blue vertical dashed lines mark the peak times of ΔEW and SXR. (d1) The Doppler velocity field of the source region of event 1. (e1) The time series of Sun-as-a-star Hα dynamic spectrum in the source region of event 1. The navy arrow marks the red asymmetry. (a2)–(e2) The same as (a1)–(e1) but for event 2. The navy and cyan arrow marks the flare ribbons. An animation is available online, which displays the evolution of events 1 and 2. The animation’s duration is 4 s.
(An animation of this figure is available in the online article.)
(An animation of this figure is available.)
The video/animation of this figure is available in the online journal.
Other Images in This Article
Copyright and Terms & Conditions
© 2026. The Author(s). Published by the American Astronomical Society.