

Image Details
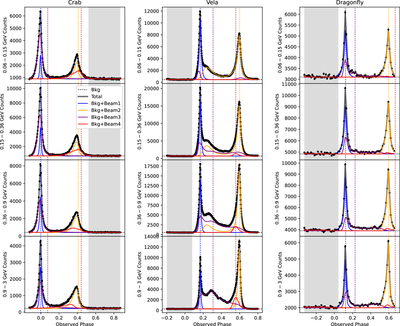
Caption: Figure 1.
Phaseograms and four-beam decomposition for Crab, Vela, and Dragonfly. Each panel shows the observed Fermi-LAT phaseogram in four energy bands between 60 MeV and 3 GeV, together with the best-fitting four-beam model and the contributions from the individual beams. The lower-altitude beam pair (Beams 1 and 2) reproduces the main double-peaked structure, while the higher-altitude beam pair (Beams 3 and 4) accounts for the bridge-like and interpulse emission. Each vertical dotted line spanning over a column of panels indicates the pulse phase when a beam axis is closest to our line of sight (not to be confused with the actually observed peak phase, which is further modulated by the Doppler shift). The gray shaded intervals were defined as the off-pulse phase range in previous literature (J. Aleksić et al. 2012; H. E. S. S. Collaboration et al. 2018; Y. Wang 2025).
Other Images in This Article
Copyright and Terms & Conditions
© 2026. The Author(s). Published by the American Astronomical Society.

